Startup Times
When a container group starts, its image is first pulled from your registry into SaladCloud’s internal caches in Europe and the US (only once), and then distributed to the allocated nodes. Startup times can range from a few minutes to longer, depending on image size and network conditions. Nodes closer to a cache or with higher throughput may come online sooner. Using smaller images to reduce transfer and decompression time, as well as deploying workloads in specific regions, can further improve startup speed. The 2024 test results show a batch transcription pipeline running on100 container instances with an 8.36 GB image and
across all consumer GPU types and regions. The test began at 22:00 and ran for 10 hours. The metric reflects the
system’s actual processing capacity over time, measured as the number of videos downloaded and transcribed per second,
with an average video duration of 3,515 seconds.
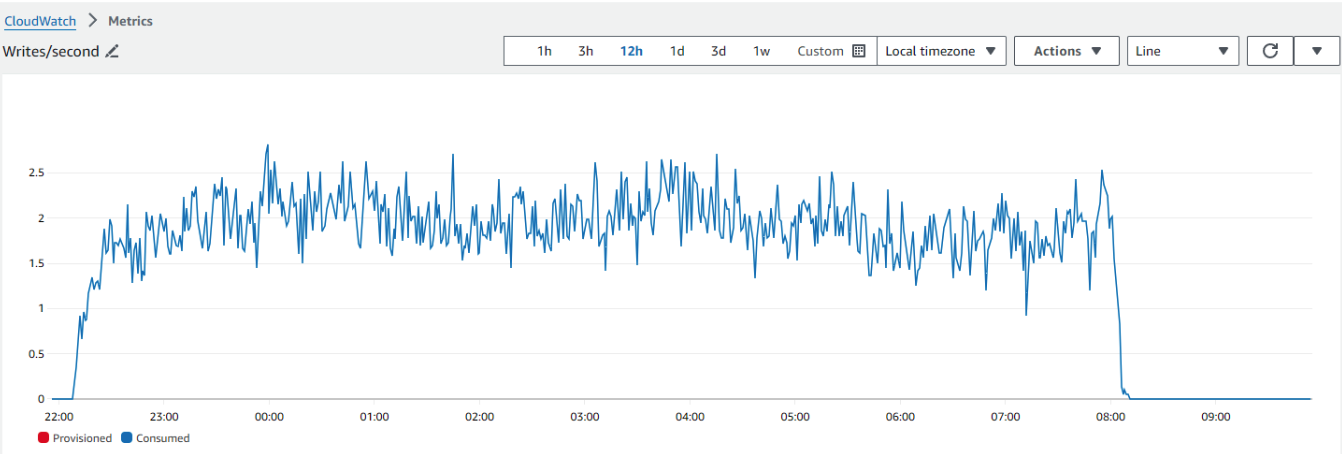
- Nodes began coming online, processing requests, and reporting results within
10 minutesof the test start. After 30 minutes, the system reached70~80%of its maximum measured capacity, transcribing over 2.5 videos per second.- The measured processing capacity fluctuated due to variations in video length and changes in the number of running instances caused by nodes going offline and being reallocated.
Uptimes
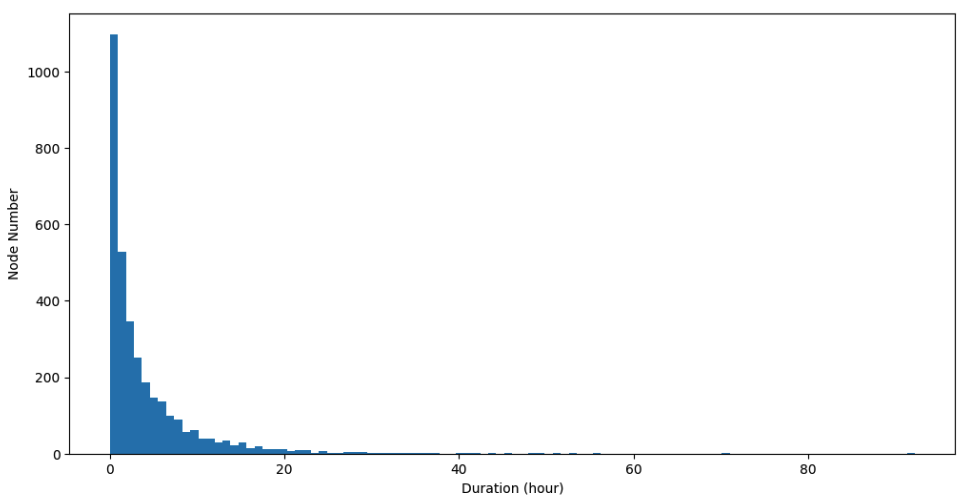
A node can go offline for various reasons after coming online, in which case a new node is allocated to continue processing. The most common reason is that node owners—whether individuals or data center providers—temporarily reclaim their resources for their own use, stopping the sharing. As a result, many nodes may fail quickly, running for only a few minutes after starting. However, nodes tend to remain stable over time, as their owners continue to earn revenue. Priority also plays a role. During periods of high SaladCloud usage, higher-priority container groups can preempt lower-priority ones when a higher-paying job becomes available. The 2024 test results show a workload at batch priority running on100 container instances across all consumer GPU
types and regions for a duration of 7 days:
- Over 3,000 nodes were utilized, averaging more than 400 nodes per day, with many nodes used multiple times during the period.
- On average, a node remained online for about
5 hours at a timebefore going offline. - Approximately
34%of nodes exited withinthe first 60 minutes. - More than
30%of nodes ran longer than the average duration of 5 hours.
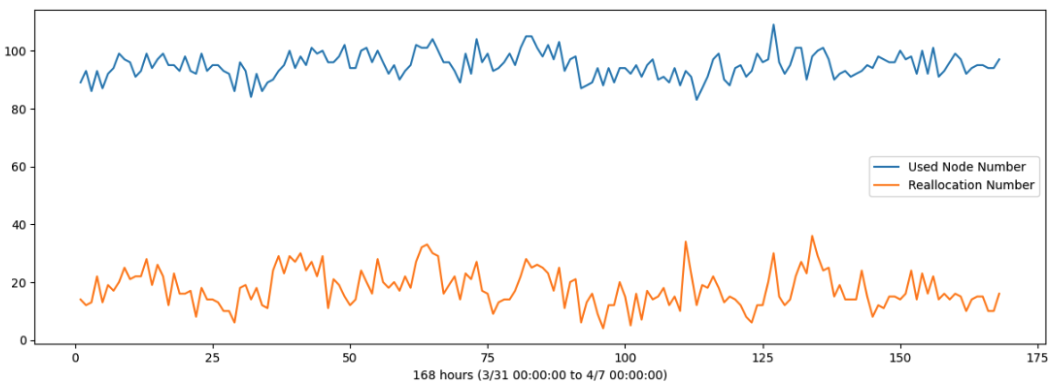
Node Run-to-Request Ratio
Due to variations in node uptimes and startup times, it is not possible to consistently achieve the full requested compute capacity on SaladCloud. When a node goes offline and a replacement is allocated, additional time is required to download and decompress the image before the new node becomes operational. These long and variable startup times also make real-time autoscaling impractical. Results from the same test—100 instances over 7 days—show that both the hourly number of running nodes and reallocated
nodes fluctuated. However, on average, 90% of the node run-to-request ratio was achieved.
Network Speed, Variance and Throughput
Salad nodes with consumer GPUs often exhibit asymmetric bandwidth, as many operate on residential networks with high download speeds—frequently hundreds of Mbps—but lower upload speeds, sometimes only tens of Mbps. The 2025 test results, based on over 200 consumer GPU nodes performing upload and download tasks, reveal significant speed variance and bandwidth asymmetry. Nevertheless, a substantial number of nodes still provide symmetric bandwidth and strong overall performance.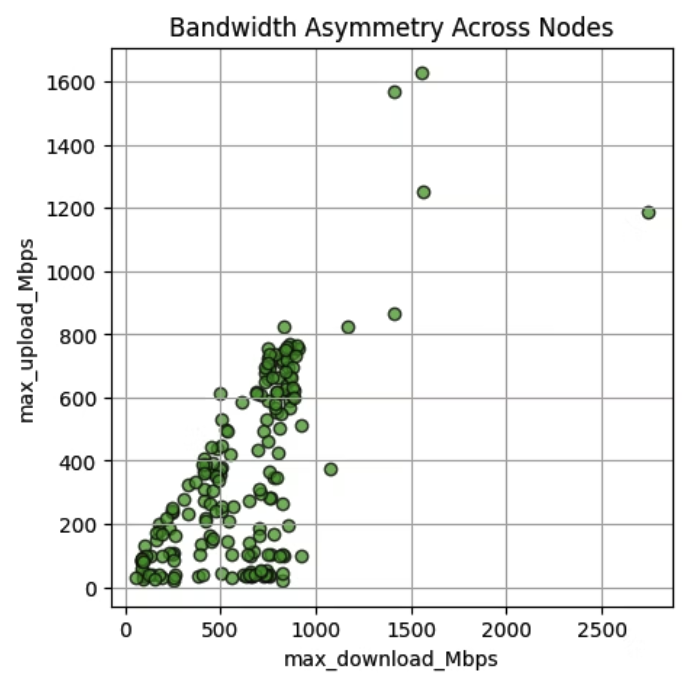
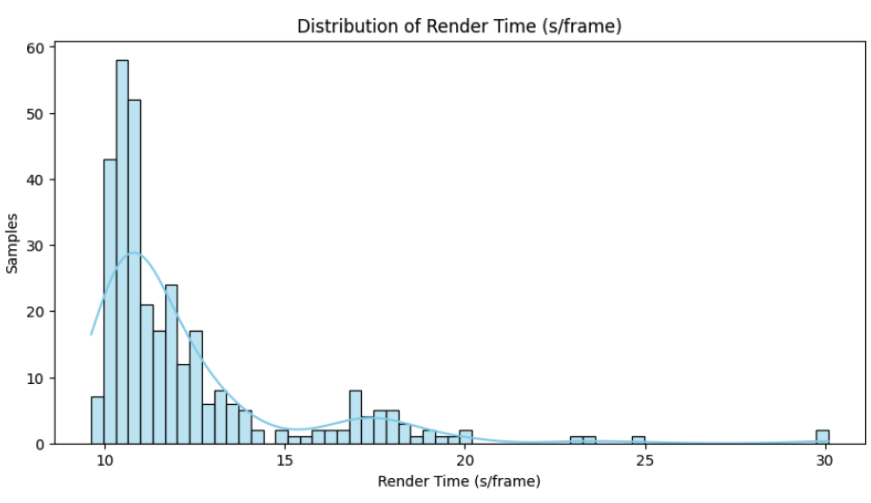
Processing Performance Variance and Fluctuations
Nodes with the same GPU type may deliver different performance due to factors such as system configuration (CPU, RAM), clock speed, cooling, and power limits. Node performance may also fluctuate over time due to the shared nature of the consumer GPUs on SaladCloud. When node owners begin using their devices, they are likely to disable the SaladCloud agent, triggering node reallocation. However, if the agent remains active while other applications are running, the performance of workloads could be impacted. The 2025 test results, based on over 300 nodes with the same consumer GPU type performing the same rendering task, show varying processing times that appear to follow at least two distinct underlying distributions. Similar patterns could be observed in other applications, such as image generation and LLM workloads.